Click here to download the fact sheet.
Click here to download my brochure.
MPH720 Class blog
Tuesday, July 17, 2012
Monday, July 16, 2012
Assignment Blog # 2
The debate on climate change, also
known as global warming, has been constantly grabbing the attention of many
environmentalists, researchers, politicians, and citizens all over the world. I
think that climate change is a very important global issue that could directly
and indirectly affect the world. Contrary to some belief, climate change is
real and it continues to affect the entire world. With all of the technological
advances in today’s bustling global society as well as steady rates of
population growth, climate change impacts physical and biological organisms. The
main gateway for humankind in conjunction to climate change globally is the
increase of greenhouse gas emissions. Direct physical effects include the
melting of glaciers, warmer temperatures during spring and summer months,
warming of bodies of water, abundance of weather pattern changes as well as
disturbing plant and animal entities. An
increase in the population somewhat inadvertently effects climate change. No
type of population control in majority of the world exists. All seven of the
continents in the world are affected because of climate change produced by
mankind. To ignore this global issue could have detrimental consequences on our
world.
Wednesday, July 11, 2012
Rachel Carson
Rachel Carson raised a widespread of public concern regarding pesticides and pollution of the environment. Her book facilitated the ban of DDT (dichlorodiphenyltrichlorethane) pesticides in 1972 in the United States. Her book catalogued environmental impacts of DDT pesticides. Silent Spring also questioned the releasing of large amounts of chemicals into the environment and its effect on the ecology as well as human health. The title "Silent Spring" was meant to evoke a spring season without any birds being heard as a result of the pesticide abuse. Silent Spring also raised important questions of the impact of the chemical industry and humankind impact on nature. Rachel Carson recognized the importance of the environment and how it continued to effect humankind in both the short and long term scales of time.
Monday, June 4, 2012
Assignment 2: MAPS
Chloropleth Map of Radon Zones in Louisiana
Ø Red: Zone 1 counties have a
predicted average indoor radon screening level greater than 4 pCi/L
(picocuries per liter) (red zones) HIGHEST
POTENTIAL
Ø Orange: Zone 2 counties have a
predicted average indoor radon screening level between 2 and 4 pCi/L
(orange zones) MODERATE POTENTIAL
Ø Yellow: Zone 3 counties have a
predicted average indoor radon screening level less than 2 pCi/L (yellow
zones) LOW POTENTITAL
|
The purpose of this map is to assist National, State, and
local organizations to target their resources and to implement radon-resistant
building codes. Homes with elevated levels of radon have been found in all
three zones. All homes should be tested regardless of geographic location.
Dot density map: HIV in Thailand
Ø Dot density map of young men who tested positive for HIV
at time of entry into the Royal Thai Army, Thailand, November 1991–May 2000.
Each dot represents one man. Location of dots based on recruit’s residence
during the previous 2 years. Data on recruits entering in November 1993 and May
1994 are not available.
A dot density map is a type of
map that uses a dot symbol that may serve to geographically present a problem
area and provide information regarding clusters of areas of high prevalence
rates of a particular feature or phenomenon.
Proportional Symbol Map: France
ØMean
annual water stress duration, calculated for 12 weather stations in France
(data Météo-France), as the number of days of water deficit averaged over the
1983–1993 period. Size of the symbols is proportional to drought duration,
represented by 15 days categories, the smallest symbol representing 1 month and
the largest one over 2.5 months.
Proportional-symbol maps are used
to illustrate geographic data. The symbols are scaled proportionally to their
value and placed next to their corresponding geography.
Topographic Map of California’s Earthquakes
ØThis map shows the relative
intensity of ground shaking and damage in California from anticipated future
earthquakes. Although the greatest hazard is in the areas of highest intensity
as shown on the map, no region within the state is immune from potential for
earthquake damage. Expected damages in
California in the next 10 years exceed $30 billion.
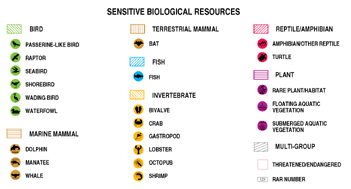
Environmental Sensitivity Index (ESI) Map: Vieques Island,
Puerto Rico
ESI products serve as quick
references for oil and chemical spill responders and coastal zone
managers. The ARD watershed projects use
this information as a baseline reference for potential physical and biological
resources in and around the aquatic environment. This information can be used to evaluate
restoration opportunities for habitat and for terrestrial and aquatic species.
ESI
maps include three kinds of information:
Biological Resources: Oil-sensitive animals, as well as habitats
that either (a) are used by oil-sensitive animals, or (b) are themselves
sensitive to spilled oil (e.g., coral reefs).
Shoreline Rankings: Shorelines are ranked according to their sensitivity, the
natural persistence of oil, and the expected ease of cleanup.
Human-Use Resources: Resources and places important to humans
and sensitive to oiling, such as public beaches and parks, marine sanctuaries,
water intakes, and archaeological sites.
Friday, May 25, 2012
Google Earth Assignment. Meghan Gondron.
I chose Abbey Road. I traveled to London, England in April 2011. The Beatles are one of my favorite bands ever and I actually got to walk across the crosswalk where the Beatles shot the famous album cover to their last album. YouTube videos helped me tremendously with creating a path and utilizing the polygon.
Subscribe to:
Comments (Atom)


